Looking for a quick data analytics exercise for financial statement analysis in an introductory accounting class? You can give your students the link for this financial statement analysis dashboard and then ask a series of questions. There is no software for students to install; the dashboard is hosted on Tableau Public and can be accessed by anyone with the link to the mini-dashboard. There is also a quick video about using mini-dashboards in Tableau Public – that mini-dashboard intro video is available at this link.
To get you started on the kinds of questions you can ask with this financial statement analysis mini-dashboard, here are some ideas:
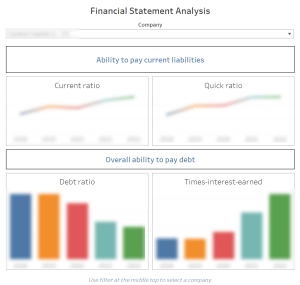
- What is the current ratio for <insert company name here> for <insert year here>?
- What is the quick ratio for <insert company name here> for <insert year here>?
- What is the debt ratio for <insert company name here> for <insert year here>?
- What is the times-interest-earned ratio for <insert company name here> for <insert year here>?
- What is your overall assessment of the financial condition of <insert company name here> based on the ratios given here?
We have made several of these mini-dashboards and have found that they are a quick and easy way to insert some data analysis into an introductory accounting course. More of these mini-dashboards are coming soon. We hope you find them useful.
Wendy
