Are you interested in data cleaning and visualization? Have you heard about Tableau and/or Tableau Prep and want to learn more? Want a ready-made project for your class that uses Tableau and Tableau Prep for data cleaning and visualization? We have developed a case that is suitable for introductory accounting that uses Tableau and Tableau Prep – and we provide step-by-step tutorial videos, making it easy to use in your classes.
Join us on Monday, August 9, from 2 – 2:30 pm Eastern, for a webinar on “ETL for introductory accounting: Tableau/Tableau Prep beginner project (KAT Concession Supply).” We will be covering how to request the instructor materials, what the project covers, how you can use it in your own classes, and more!
We will also answer any questions you have. The webinar is from 2 – 2:30 pm Eastern – you can register for this webinar at this link.
To see all the webinars we have scheduled, see our website webinar page at this link.
Are you interested in data cleaning and visualization? Do your students use Google Sheets? Want a ready-made project for your class that uses Google Sheets for data cleaning and visualization? We have developed a case that is suitable for introductory accounting that uses just Google Sheets – and we provide step-by-step tutorial videos, making it easy to use in your classes.
Join us on Tuesday, July 19, from 1 – 1:30 pm Eastern, for a webinar on “ETL for introductory accounting: Google Sheets beginner project (KAT Concession Supply).” We will be covering how to request the instructor materials, what the project covers, how you can use it in your own classes, and more!
We will also answer any questions you have. The webinar is from 1 – 1:30 pm Eastern – you can register for this webinar at this link.
To see all the webinars we have scheduled, see our website webinar page at this link.
Are you interested in Alteryx but have not yet delved into it? Want a ready-made project for your class that uses Alteryx and Power BI for data cleaning and visualization? We have developed a case that is suitable for introductory accounting that uses Alteryx and Power BI – and we provide step-by-step tutorial videos, making it easy to use in your classes.
Join us on Wednesday, July 13, from 11 – 11:30 am Eastern, for a webinar on “ETL for introductory accounting: Alteryx beginner project (KAT Concession Supply).” We will show Alteryx and discuss how you and your students can get it for free. We will also be covering how to request the instructor materials, what the project covers, how you can use it in your own classes, and more!
We will also answer any questions you have. The webinar is from 11 – 11:30 am Eastern – you can register for this webinar at this link. We will also make a recording of the webinar available after it concludes.
To see all the webinars we have scheduled, see our website webinar page at this link.
Greetings! Just a quick reminder that next week on Tuesday, June 28, we are hosting a 30-minute webinar on our KAT Concessions: ETL (data cleaning) for introductory accounting Excel beginner project – how to request the instructor materials, what the project covers, how you can use it in your own classes, and more! We will also answer any questions you have. The webinar is from 11 – 11:30 am Eastern – you can register for this webinar and others at this link.
Greetings! Just a quick reminder that tomorrow, Wednesday, June 8, we are hosting a 30-minute webinar on our KAT Manufacturing data analytics projects for introductory accounting – how to request the instructor materials, what the projects cover, how you can use them in your own classes, and more! We will also answer any questions you have. The webinar is from 1 – 1:30 pm Eastern – you can register for this webinar and others at this link.
Okay, so confession here – my guilty pleasure is TV game shows. I have created a set of data analytics games based on TV game shows that are suitable for reviewing data analytics – perhaps at the end of a unit or the end of the semester. You will find Jeopardy, Family Feud, and Who Wants to be a Millionaire games below. In addition, I also created a Kahoot! and a Connect 4 game. There is no cost for any of these games. All files are editable. Here is the list including links to resources:
Jeopardy
Here is a link to a data analytics Jeopardy! game using the online platform Jeopardy Labs. You can use the one I have created for free. Instructions are found on the same link as the game.
Kahoot!
Here is a link to a data analytics Kahoot! game. If you need information about how to play Kahoot!, the Kahoot website has a lot of resources.
Connect 4
Here are links to a Connect 4 PowerPoint data analytics game and resources:
The Instructor Guide contains information about how to play the game in the classroom. It also contains all the answers to the questions in the game. The PowerPoint can be
Family Feud
Here are links to a Family Feud PowerPoint data analytics game and resources:
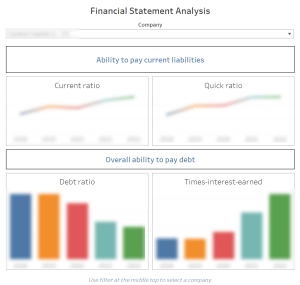
Looking for a quick data analytics exercise for financial statement analysis in an introductory accounting class? You can give your students the link for this financial statement analysis dashboard and then ask a series of questions. There is no software for students to install; the dashboard is hosted on Tableau Public and can be accessed by anyone with the link to the mini-dashboard. There is also a quick video about using mini-dashboards in Tableau Public – that mini-dashboard intro video is available at this link.
To get you started on the kinds of questions you can ask with this financial statement analysis mini-dashboard, here are some ideas:
What is the current ratio for <insert company name here> for <insert year here>?
What is the quick ratio for <insert company name here> for <insert year here>?
What is the debt ratio for <insert company name here> for <insert year here>?
What is the times-interest-earned ratio for <insert company name here> for <insert year here>?
What is your overall assessment of the financial condition of <insert company name here> based on the ratios given here?
We have made several of these mini-dashboards and have found that they are a quick and easy way to insert some data analysis into an introductory accounting course. More of these mini-dashboards are coming soon. We hope you find them useful.
The introductory accounting ETL projects continue…today we are releasing the data cleaning project for Google Sheets. Google Sheets is a nice option to have available in case your student(s) only have access to a Chromebook; this project will run entirely on a Chromebook.
A key step in data analytics is getting the data ready for use – in fact, this step can take more time and effort than the analysis of the data. This brand-new Google Sheets project focuses on the data cleaning aspect of data analytics and is appropriate for introductory accounting – but could be adapted to any accounting class. This Google Sheets case is designed to guide students through data cleaning and data analysis with step-by-step tutorial videos.
KAT Concession Supply is a fictitious company that supplies food, paper products, and other items to fairs, amusement parks, and other organizations. Information in the KAT Concession Supply data sets includes information about its sales over a three-year period. The data from KAT Concession Supply has errors and irregularities in it and it must be cleaned so that an interactive dashboard about its operations can be prepared. This Google Sheets project is classified as beginner because it takes less than an hour to complete the entire project and the steps are pretty basic.
Complete step-by-step tutorial videos and an instructor guide are available to make project adoption easy and painless in accounting courses. The project is available at no cost for instructors to use in their classes.
Beginner project for Google Sheets
The ETL and other tasks in the beginner version of the Google Sheets data cleaning project are:
Widen all columns to automatically fit the contents
Find and remove duplicate records
Remove unwanted characters such as numbers, spaces, and nonprintable characters from fields
Find and replace text with replacement text
Change the case of a text field to uppercase or lowercase
Format numbers
Create a two-visualization interactive dashboard
Tutorial videos/PDFs
Complete step-by-step instructions are provided for this project. Students have the choice of viewing the tutorial videos or downloading a pdf file of the annotated slides. The tutorials for this project have been split into two parts:
***You can obtain the Instructor Guide for the KAT Concession Supply beginning data cleaning project for Google Sheets by requesting it at this link.*** The instructor guide contains the data set, solutions, and other information.
Give us about 5 – 8 days to respond – but check your Spam folder for the email if you do not see our email within that approximate time frame. (You may want to add drwendytietz@gmail.com to your Safe Senders list. Please don’t email to that email address – that is an email address used solely for distributing the project resources we have developed. Thank you!)
News flash: This data cleaning project is the third project in a set of ten data cleaning and visualization projects developed by Tracie Miller-Nobles, Jennifer Cainas, and me. We will be releasing new projects approximately twice a month for the remainder of 2022. These projects will be available in three levels: Beginner (five data cleaning techniques plus two-visualization dashboard); Intermediate (beginner steps with seven additional data cleaning techniques plus three-visualization dashboard); and Advanced (intermediate steps with additional data cleaning techniques plus four-visualization dashboard.) In addition, the projects will be available in four software tool combinations: Excel, Google Sheets, Tableau Prep combined with Tableau, and Alteryx combined with Power BI.
Looking for a quick data analytics exercise for introductory managerial accounting? You can give your students the link for this job cost analysis dashboard and then ask a series of questions. There is no software for students to install; the dashboard is hosted on Tableau Public and can be accessed by anyone with the link to the mini-dashboard. We also have a quick video about using mini-dashboards in Tableau Public – that mini-dashboard intro video is available at this link.
To get you started on the kinds of questions you can ask with this job cost mini-dashboard, here are some ideas:
What is the gross profit generated by the <insert product type here> product group in all plants?
What is the total sales revenue generated by <insert product ID here> in the <insert plant location here> plant?
How many <insert product ID here> models were sold by the <insert plant location here> location?
What is the gross profit of the <insert product type here> product group in the <insert plant location here> plant?
Anyways, we have made several of these mini-dashboards and have found that they are a quick and easy way to insert some data analysis into an introductory accounting course. We will be sharing some of these mini-dashboards from time to time. We hope you find them useful.
We are super excited to share the first of ten projects in a set that focus on data cleaning and analytics! Read on for how to request this first beginning level project that uses Excel for data cleaning and analytics.
A key step in data analytics is getting the data ready for use – in fact, this step can take more time and effort than the analysis of the data. This brand-new Excel project focuses on the data cleaning aspect of data analytics and is appropriate for introductory accounting – but could be adapted to any accounting class.
KAT Concession Supply is a fictitious company that supplies food, paper products, and other items to fairs, amusement parks, and other organizations. Information in the KAT Concession Supply data sets includes information about its sales over a three-year period. The data from KAT Concession Supply has errors and irregularities in it and it must be cleaned so that an interactive dashboard about its operations can be prepared. This Excel project is classified as beginner because it takes less than an hour to complete the entire project and the Excel steps are pretty basic.
Complete step-by-step tutorial videos and an instructor guide are available to make project adoption easy and painless in accounting courses. The project is available at no cost for instructors to use in their classes.
Beginner project for Excel
The data cleaning and other tasks in the beginner version of the Excel data cleaning project are:
Widen all columns to automatically fit the contents
Find and remove duplicate records
Remove unwanted characters such as numbers, spaces, and nonprintable characters from fields
Find and replace text with replacement text
Change the case of a text field to uppercase or lowercase
Format numbers
Create a two-visualization interactive dashboard
Tutorial videos/PDFs
Complete step-by-step instructions are provided for this project. Students have the choice of viewing the tutorial videos or downloading a pdf file of the annotated slides. The tutorials for this project have been split into two parts. You can view the tutorial videos here as a preview of this project:
***You can obtain the Instructor Guide for the KAT Concession Supply beginning data cleaning project for Excel by requesting it at this link.*** The instructor guide contains the data set, solutions, and other information.
Give us about 5 – 8 days to respond – but check your Spam folder for the email if you do not see our email within that approximate time frame. (You may want to add drwendytietz@gmail.com to your Safe Senders list. Please don’t email to that email address – that is an email address used solely for distributing the project resources we have developed. Thank you!)
News flash: This data cleaning project is the first project in a set of ten data cleaning and visualization projects developed by Tracie Miller-Nobles, Jennifer Cainas, and me. We will be releasing new projects approximately twice a month for the remainder of 2022. These projects will be available in three levels: Beginner (five data cleaning techniques plus two-visualization dashboard); Intermediate (beginner steps with seven additional data cleaning techniques plus three-visualization dashboard); and Advanced (intermediate steps with additional data cleaning techniques plus four-visualization dashboard.) In addition, the projects will be available in four software tool combinations: Excel, Google Sheets, Tableau Prep combined with Tableau, and Alteryx combined with Power BI.